Choosing the right cable to use in any application depends on many parameters. One of the most important is its ability to thermally resist a maximum imposed current.
Simulating Heat Transfer in Power Cables Using the Finite Element Method (FEM)
Mehdi Rezzouk, R&D Laboratory Engineer | Fischer Connectors
This is particularly true when dealing with heating problems caused by electrical resistance.
Engineering by digital simulation has become mainstream, helping engineers to solve increasingly complex problems while shortening the prototyping and testing stages. It enables them to better anticipate, understand and optimize the operation, development and design of many products. Above all, it has the advantage of covering a wide range of application domains, across multiple dimensional scales.
As far as the cable is concerned, it is known that its maximum use limit is determined by the heat resistance of its components. This aims to avoid any irreversible degradation that could endanger the system in which it is integrated. Nevertheless, implementing experimental procedures to better define the ins and outs of such a problem is work that takes considerable material resources. Using a multiphysics simulation software like COMSOL®, combined with application know-how, therefore brings real added value when resolving this type of problem, since it helps to better understand: the temperature behavior of the multiple components (strength member, fillers, binder wrap, jacket insulation, braided shield, etc.); the effect of the environment on the cable (type of environment, outside temperature, fluid velocity, etc.); as well as the characteristics of heat dissipation within the materials (heat transfer, fluid-solid exchange).
Process capabilities
Indeed, using such a tool, it is possible to determine the two-dimensional temperature distribution inside a cable for a multitude of geometrical configurations and load cases.
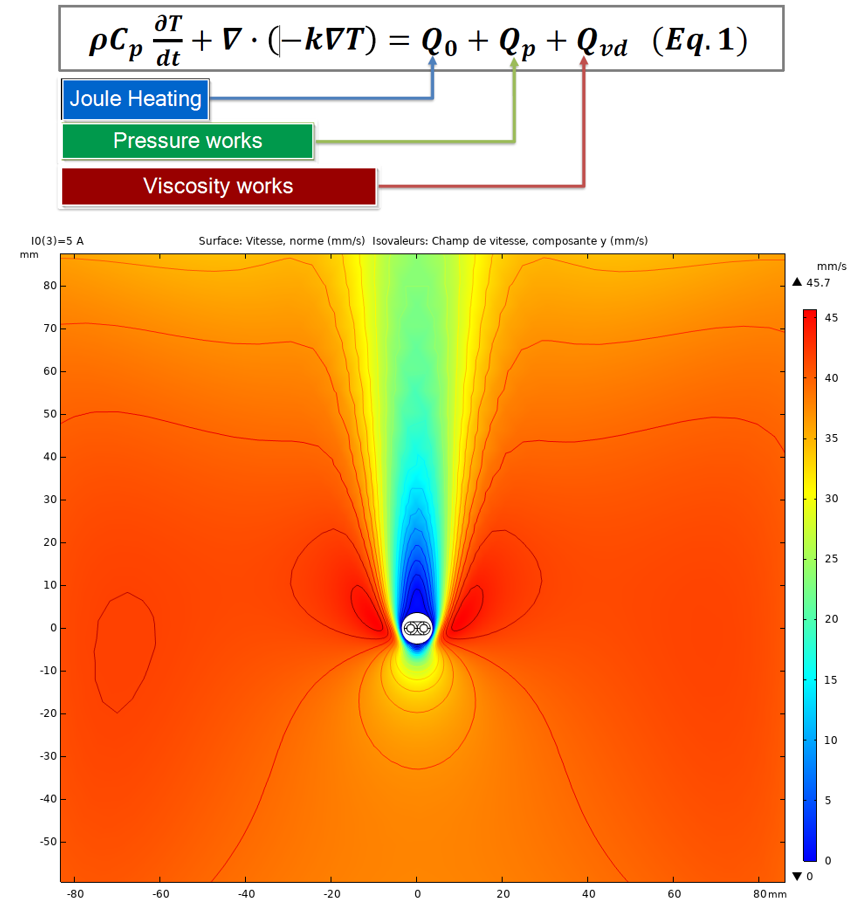
By coupling the mathematical equations of heat (Fourier) and fluid mechanics (Navier-Stokes), it is possible to visualize temperature and pressure behavior, as well as the speed of fluid in the vicinity of the cable (Figure 1). Established models take into consideration not only the three modes of heat transfer, i.e. conduction, radiation and convection, but also the variation of resistivity with temperature as well as the acting pressure and viscous forces. Using analytical calculations and experimental laboratory tests, these models have been verified for a wide range of cables and conductors considering fundamental material characteristics such as thermal conductivity, electrical resistivity, emissivity, temperature coefficient, etc.
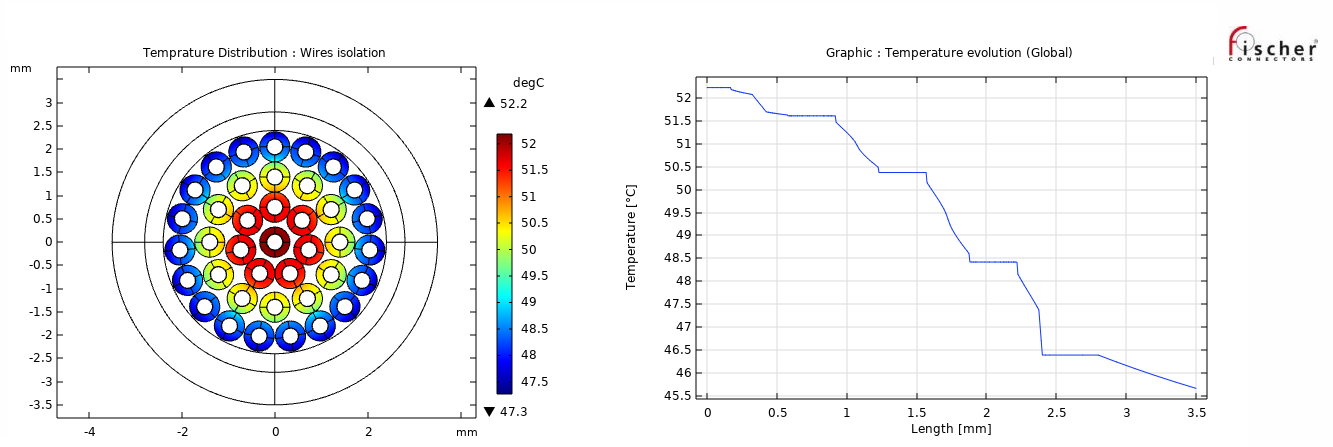
Taking advantage of a considerably low computation time and a meshing adapted to the various components of the cable, an application developed in-house enables us to extract the fundamental heating data of a selected cable architecture; for example, to obtain the multilayer temperature gradient with associated graphs highlighting the maximum and minimum temperature values at critical locations on the insulators (Figure 2).
A detailed report, completed during the post-processing step, can be generated in order to gather together all the information needed for validating and verifying the results. This allows the model to be adapted to the practical case under consideration (cable with/without shielding, natural/forced convection, gaseous/liquid environment, particular geometric layout, etc.).
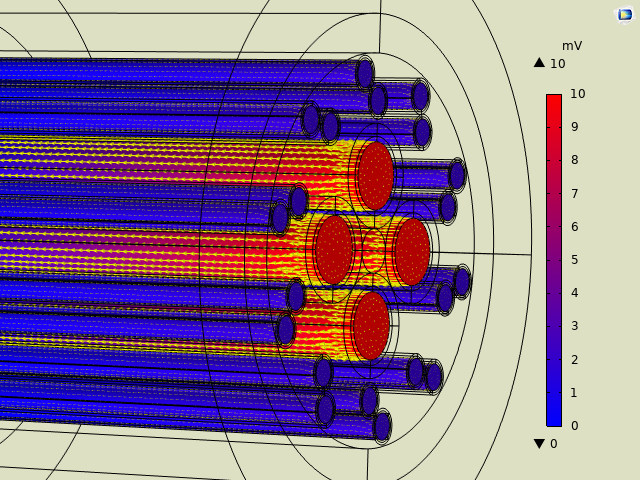
A 3D analysis is also possible by taking into account the equations governing the electric current distribution (laws of conservation of current) with the help of voltage control or by a current flow allowing the expression of load losses caused by thermal dissipation related to the Joule effect (Figure 3).
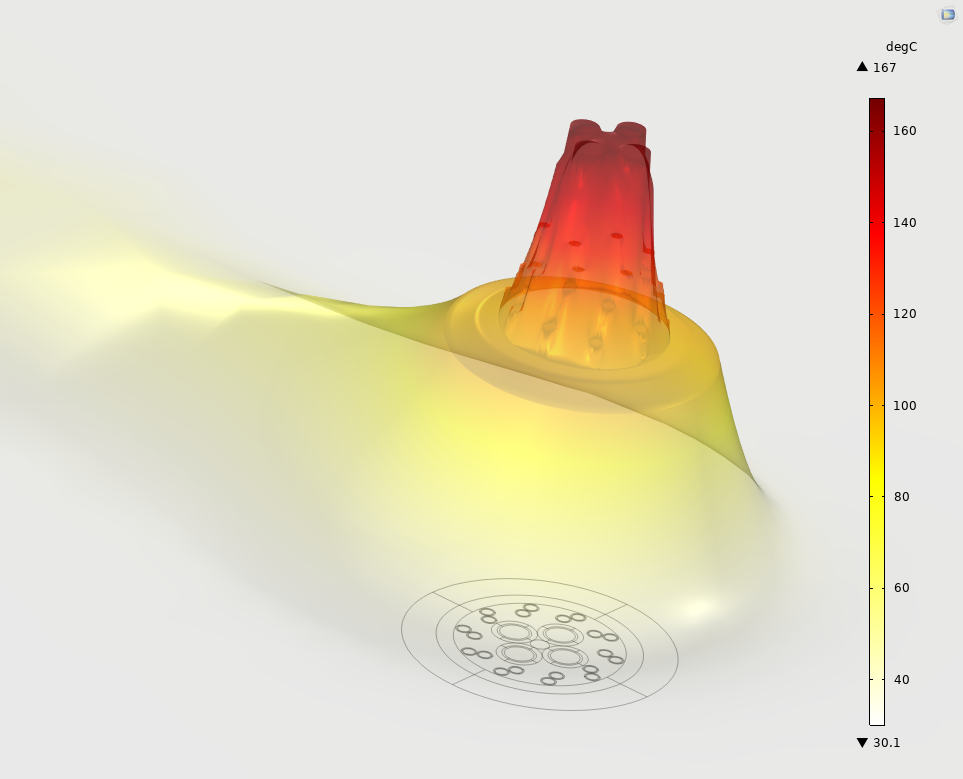
Figure 4: Example of a tridimensional heat rise analysis
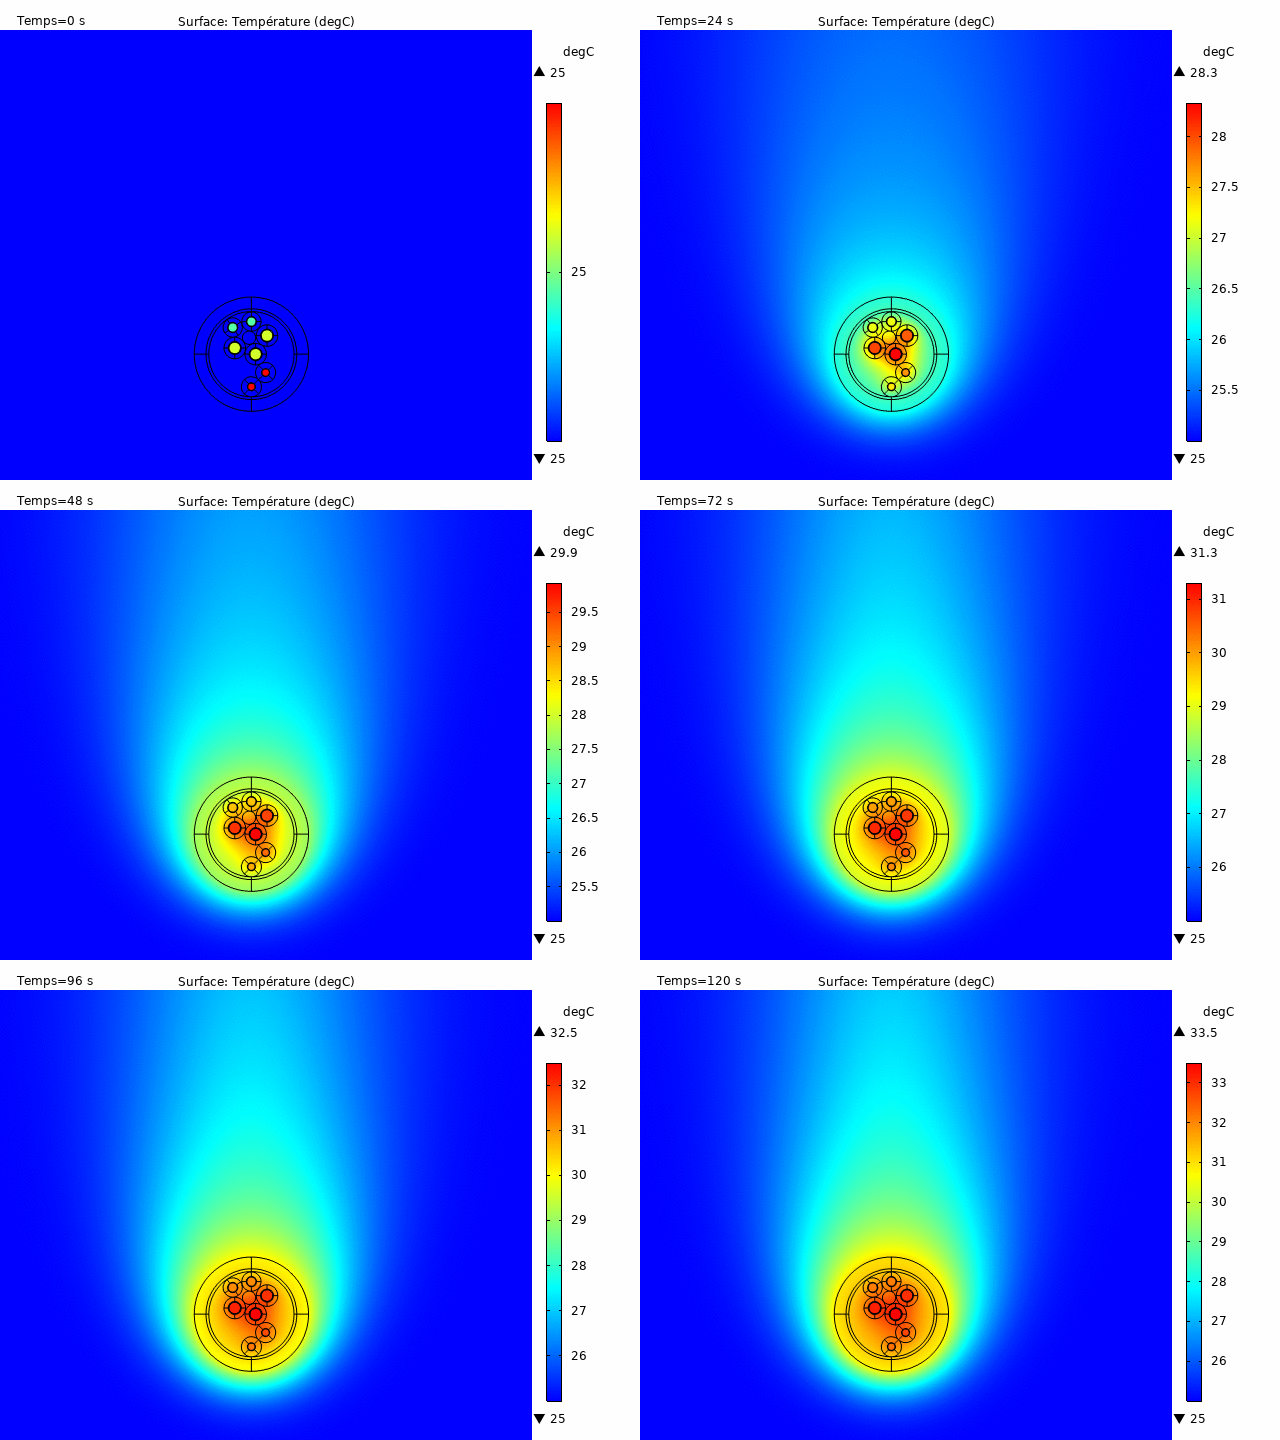
All of these analyses are deliverable in stationary, transient or steady state, also accepting the configuration of pulsed currents for both signal pairs and power lines. This enables temperature rise to be observed as a function of time for various load cases. There are multiple possibilities for visualization and data extraction, allowing a global analysis of temperature behavior according to the desired results (Figure 4).
Relevant answers
Using a mathematical tool like simulation provides relevant answers that help improve dimensioning in order to optimize a solution’s efficiency, costs and space requirements. Through an in-depth study that puts all heat transfer modes and the definition of boundary and initial conditions into perspective, Fischer Connectors is able to gain a deeper understanding of issues relating to the thermal behavior of cables and the consequences triggered in boundary use cases. We thus aim to respond to our customers’ questions, requests and needs in the most complete, precise and relevant way possible.
The content & opinions in this article are the author’s and do not necessarily represent the views of RoboticsTomorrow
Comments (0)
This post does not have any comments. Be the first to leave a comment below.
Featured Product


