Comparing drone inspection time to relevant manual inspections across the 4 sites, we saw an increase in inspection efficiency of 97%. On a per MWdc basis, cost savings due to efficiency gains ranged from $1074 to $1717 per MW, for an average of $1254/MW cost savings.
Case Study: Increasing Solar Inspection Efficiency with Drones
Contributed by | Measure UAS, Inc.
UAV (unmanned aerial vehicles) technologies provide operational efficiency gains to solar asset management. To quantify these gains, Measure compared time, costs, and results of its 100% IR drone inspections to relevant manual inspection scenarios across four solar sites. These comparisons, documented below, yielded the following results:
Drones Increased Efficiency by 97%
Drones Saved an Average of $1,254/MW
Test Site Descriptions
Site 1:
Preventative maintenance of 74MW in Sunrall, MS
Comparison: Clamp Testing with 20% IV Curve Tracing Testing
Site 2:
Preventative maintenance of 30MW in Spargue, CT
Comparison: Voc/lsc Testing at the Combiner Box with Visual Inspection
Site 3:
System Commissioning for 21MW in Rincon, GA
Comparison: 100% handheld IR scanning with 15% IV Curve Tracing Testing
Site 4:
System Commissioning for 12.5MW in Herald, CA
Comparison: 100% IV Curve Tracing Testing
Test Site Conditions
Vetted environmental factors to ensure the highest quality thermal data.
- Site irradiance greater than 600 watts/m2
- Wind speed less than 15 mph
- Cloud cover less than 2/8ths
- Panel orientation 5 ° – 60 °, where 0 ° is horizontal
- Solar noon with adjustments made to minimize site shading
Data Collection
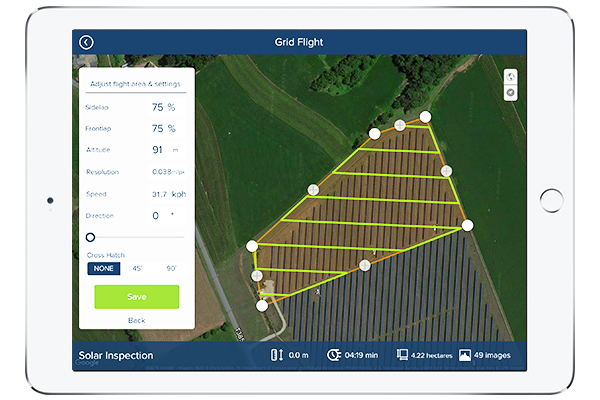
Grid flight parameters using high overlap settings and high capture frequency are required to create quality orthomosaics. Adjustible settings include altitude, overlap, image ratios, file format, and thermal camera gain setting.
Each site is flown twice, using different sensors and at different altitudes. One flight collects RGB imagery, while a second flight collects thermal imagery. Drone inspection time is 10 min/MW.
Data Engineering
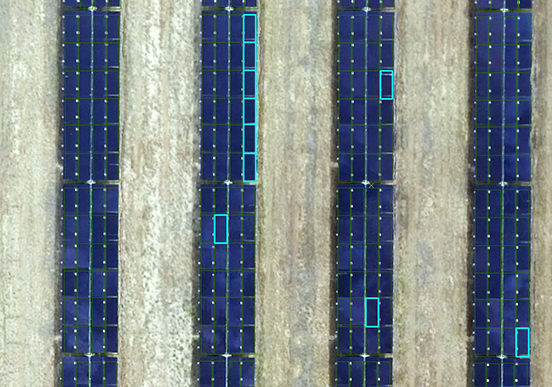
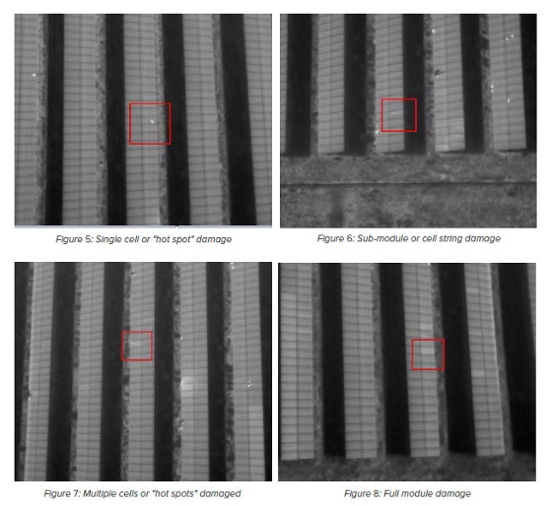
RGB and thermal data sets are combined and defects are detected using automated processing and manual review. The process includes outlining each individual panel, the identification and geo-location of thermal anomolies, and manual quality control and defect classification. Defects reporting categories include hot spot, sub-module, module, partial string and full string.
Data Delivery
Following processing and analysis, data is delivered to the client in a user-friendly, actionable format. Total time from data collection to data delivery is less than 5 business days.
PDF Inspection Reports: High level, punch list summaries of inspection results.
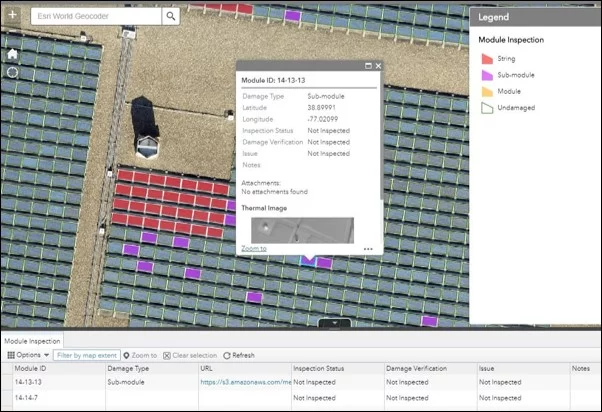
Online Portal Webmaps: Interactive data hosting platform that includes a visual representation of aerial inspection results and a data set that is exportable, georeferenced, and interactive.
Field Repair Application: Smartphone application that routes technicians to malfunctioning modules and allows corrective maintenance or field validation results to be uploaded while on-site.
Data Accuracy
To test the accuracy of our data, we took the results of a solar inspection by drone and sent out manual inspection on the same plants. The results from the manual inspection mirrored the results from the drone data with 99 percent accuracy, but the manual inspection took two days for each site compared to two hours with the drone.
Results
Comparing drone inspection time to relevant manual inspections across the 4 sites, we saw an increase in inspection efficiency of 97%.
On a per MWdc basis, cost savings due to efficiency gains ranged from $1074 to $1717 per MW, for an average of $1254/MW cost savings.
| Site 1 | Site 2 | Site 3 | Site 4 | |
| Size | 74MW | 30MW | 21MW | 12.5MW |
| Drone Inspection Time | 24 hrs | 6 hrs | 7 hrs | 4 hrs |
| Manual Inspection Time | 778 hrs | 293 hrs | 208 hrs | 195 hrs |
| Hazardous Man-hours Avoided | 754 hrs | 287 hrs | 201 hrs | 191 hrs |
| Increased Efficiency | 97% | 98% | 97% | 98% |
| Net Cost Savings | $68,399 | $25,485 | $17,063 | $19,552 |
In addition, large sites were only a percentage (e.g. 20%) of the facility undergoes IV curve tracing each year will benefit from enhanced revenue opportunities realized through 100% IR scanning. In this case, Site 1 saw an additional $91/MW in enhanced revenue opportunity.
The content & opinions in this article are the author’s and do not necessarily represent the views of RoboticsTomorrow
Featured Product